

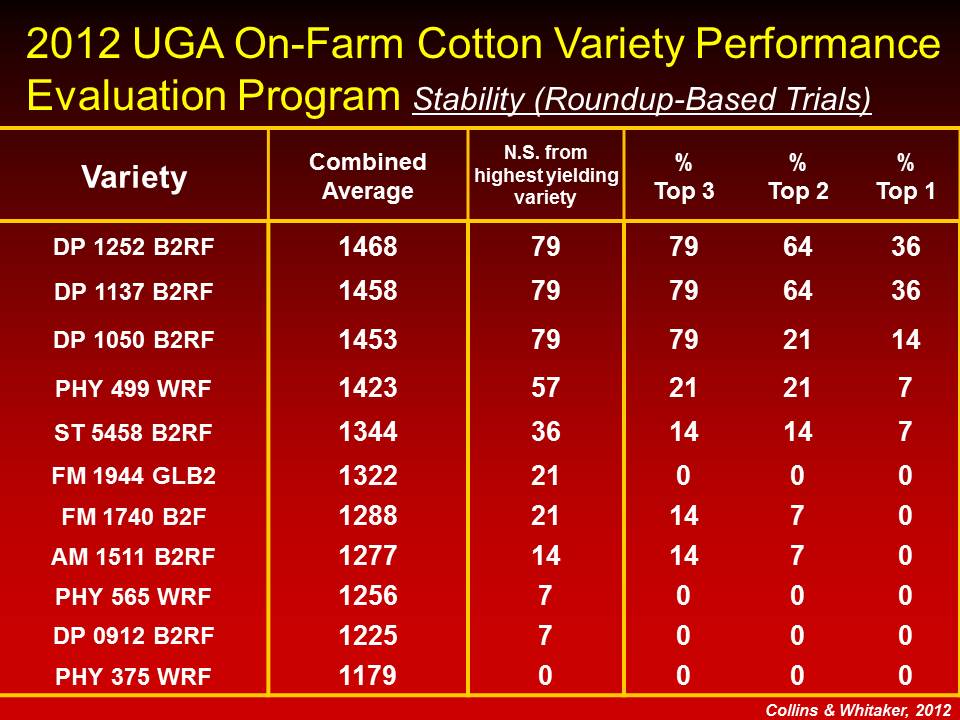
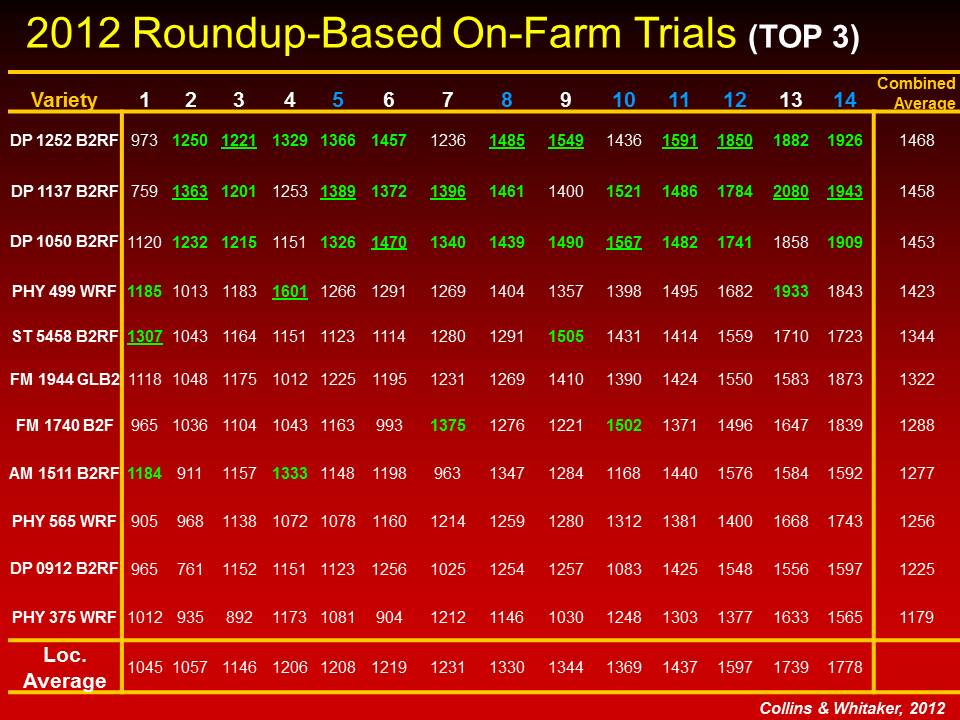
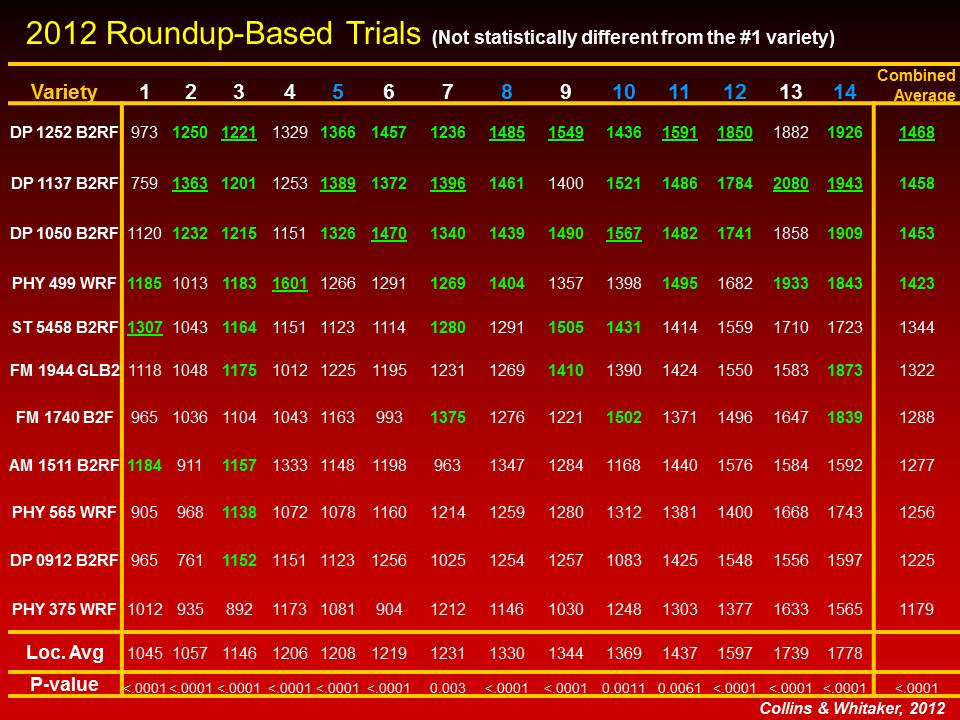
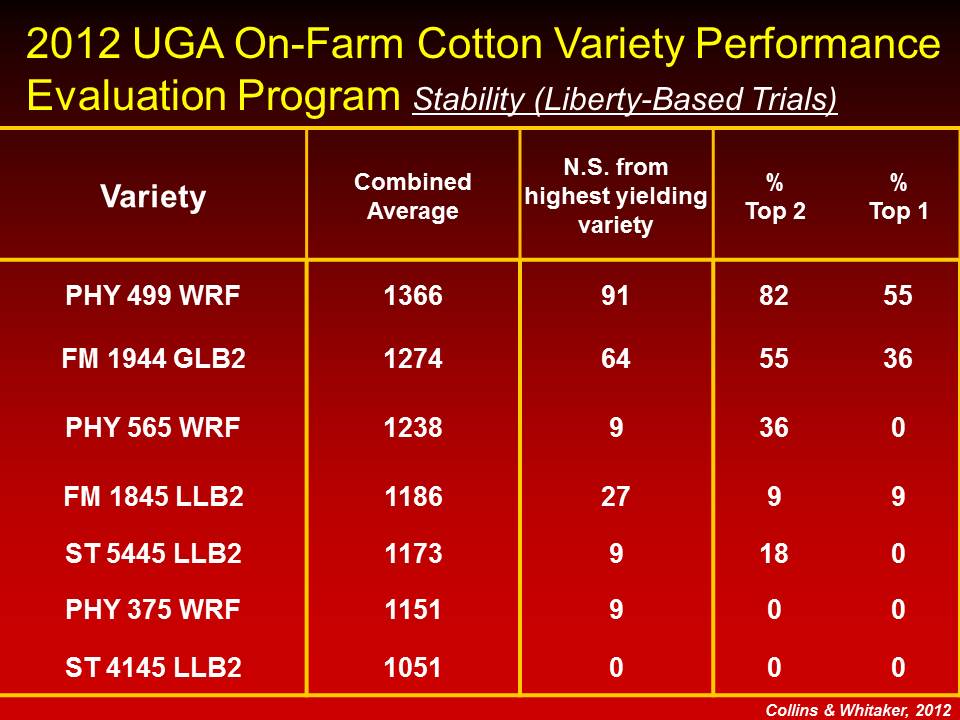
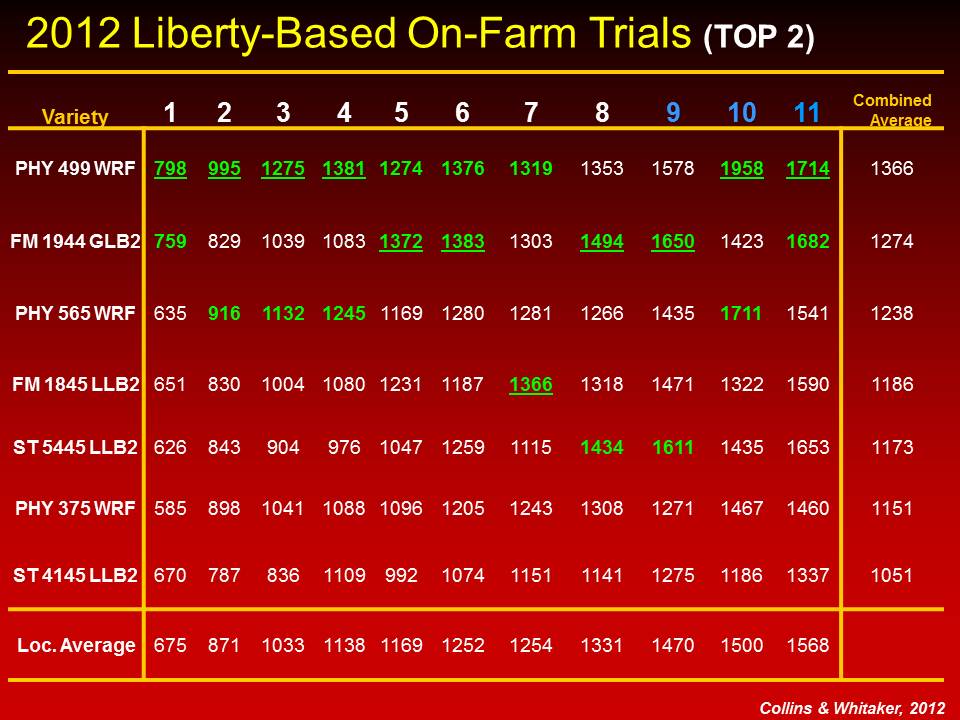
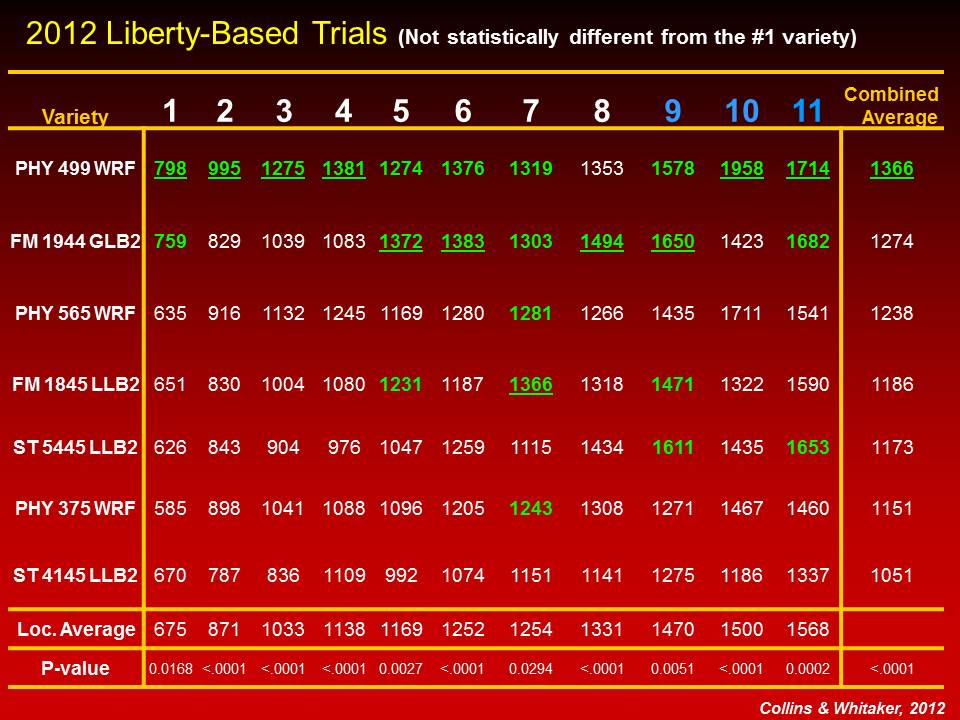
These slides contain the results of the UGA On-Farm Cotton Variety Performance Evaluation Program. In these slides, varieties are ranked in descending order according to their average yield across all trials. Each trial (environment) is listed in ascending order (from left to right) with lower yield environments on the left, and higher yield environments towards the right. The trial number (listed across the top) will appear in white font for dryland trials and blue font for irrigated trials. The number 1 variety in each trial will be underlined and the TOP 3 or the Statistically Highest Group will be highlighted in green font. The stability slides show the percentage of trials that each variety performed in the TOP 1, 2, 3, or was statistically no different than the top variety.
We would like to thank all UGA county extension agents and cooperating growers that help develop this valuable program for Georgia cotton growers.