
Thrips are consistent pests of cotton each year and nearly 100 percent of the acres planted will be infested. For this reason preventive insecticides are used at planting. The preventive insecticide used at planting (efficacy and residual activity), severity of thrips infestations, and growth rate of seedlings all influence the potential need of a supplemental foliar insecticide. All fields should be scouted for thrips. Thrips can be easily sampled by pulling plants and beating them on a piece of paper, cigar box, or cup to dislodge the thrips from each plant which can then be counted. The threshold for thrips is 2 to 3 thrips per plant with immatures present. Immature thrips are crème colored and wingless. Adults vary in color by species and are generally black to brown in color and have wings. The presence of immatures is important as immatures are an indication that the preventive insecticide is not providing control (i.e. eggs laid on the plant and the thrips hatched and are developing). Seedlings are most sensitive to thrips feeding during early plant growth stages 1-2 leaf. Once seedlings reach the 4-leaf stage and are growing rapidly economic damage is unlikely.
Historically thrips infestations tend to be greater on April and early May planted cotton. In many years the break in thrips pressure occurs around May 10. Agents and growers now have a new tool which predicts thrips risk more precisely than a calendar based method. We provided information on the Thrips Infestation Predictor tool and potential uses back in March, click the following link for that post: http://www.ugacotton.com/2018/03/a-new-tool-for-improving-thrips-management-in-cotton/.
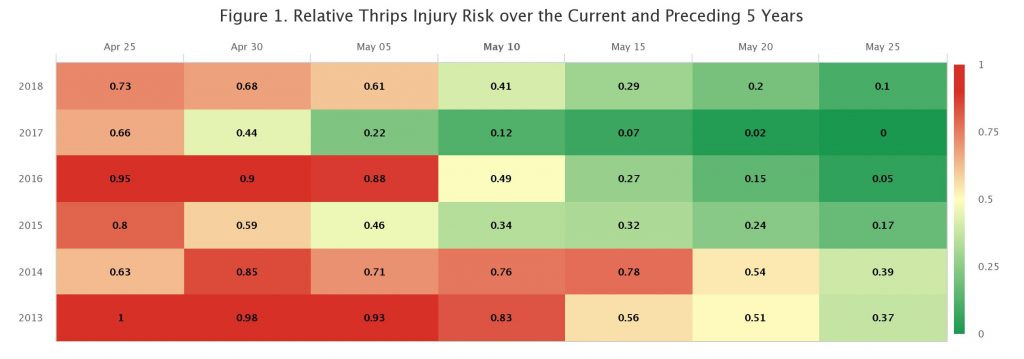
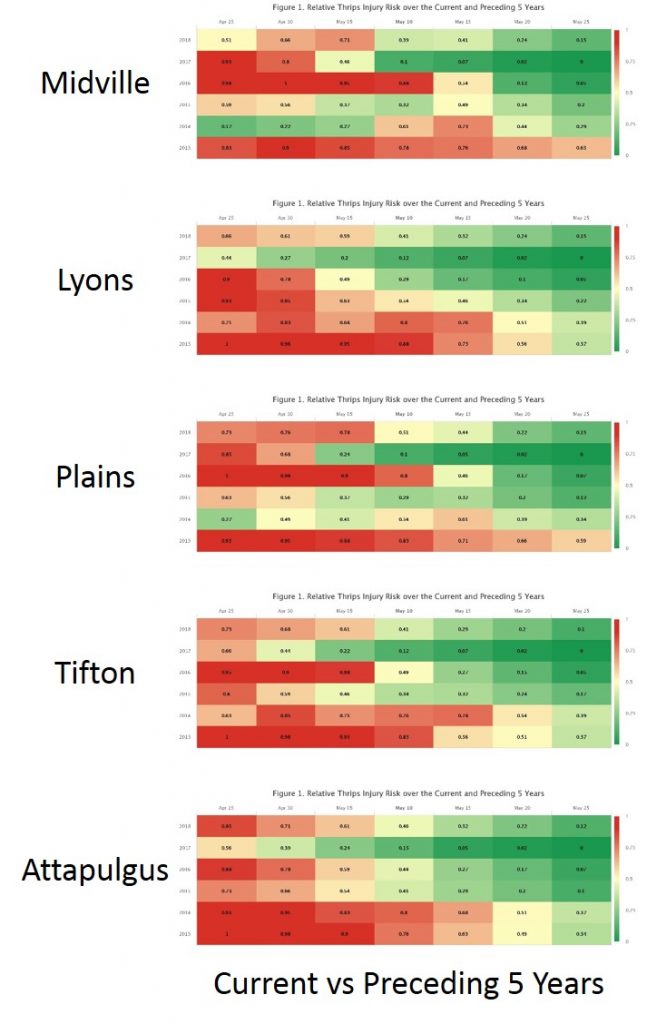
How does thrips risk compare with previous years? Relative Thrips Injury Risk over the Current and Preceding 5 Years is illustrated in Figure 1 on the TIPs tool output. Risk of each planting date and year are expressed on a scale of 0 to 1 where 0 is the lowest risk and 1 is the highest risk. For example the planting date and year with a value of 0 (dark green) is the lowest risk for a specific planting date in a given year for the 6 year period. Similarly the planting date and year with the highest risk has a value of 1 (dark red) for the 6 year period. For nearly all planting dates and locations thrips risk is higher in 2018 compared with 2017. Recall that 2017 was a light thrips year. The TIPs output below was generated for Tifton on April 30, 2018.
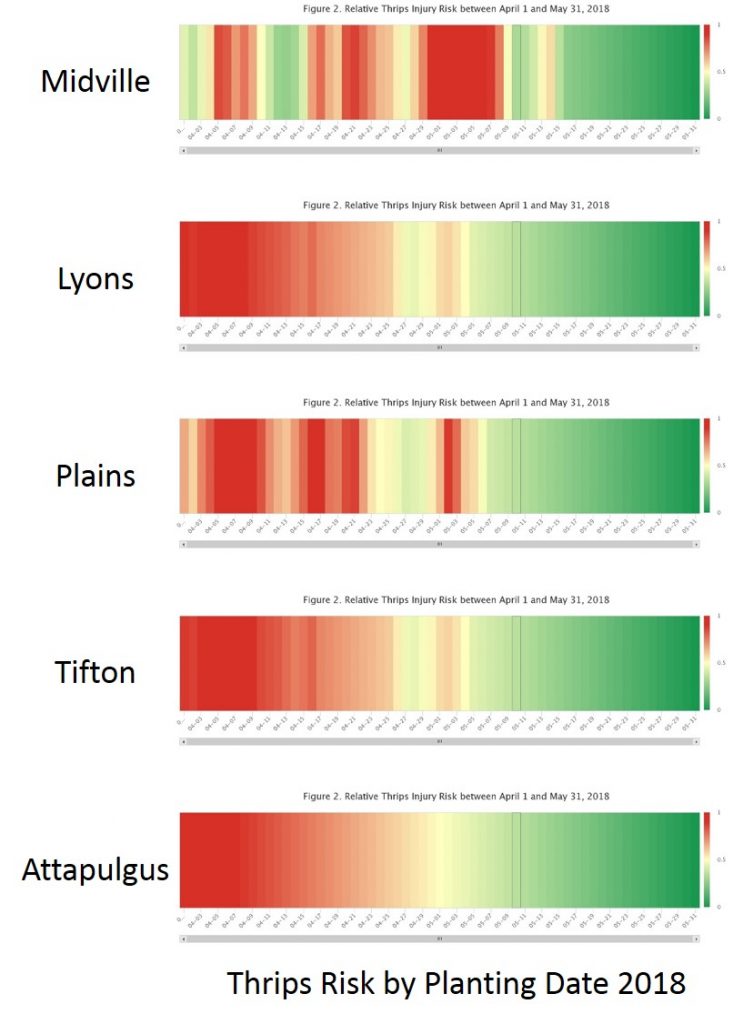
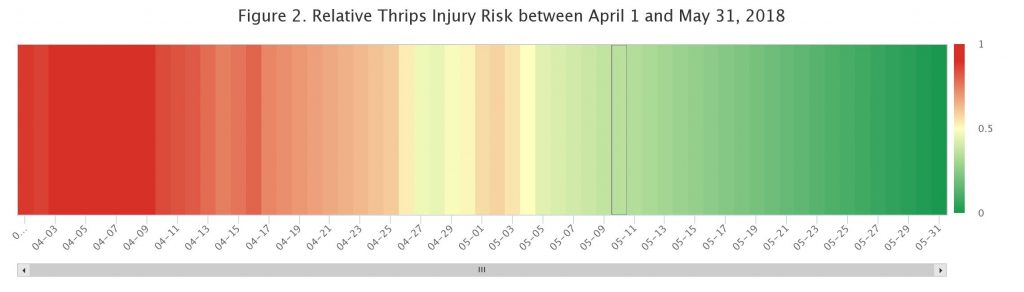
How will thrips risk vary by planting date in 2018? Relative Thrips Injury Risk between April 1 and May 31 for the current year is illustrated in Figure 2 on the TIPs tool output. The predicted risk across potential planting dates ranges from lowest (dark green) to highest (dark red) within the given year, regardless of whether the current year’s thrips risk is high or low relative to prior years. Figure 1 must be sued to interpret severity of current year thrips compared with the previous 5 years. The TIPs output below was generated for Tifton on April 30, 2018.
I ran the TIPs tool for a May 10 planting date in several locations from southwest Georgia to east Georgia (Attapulgus Research and Education Center, RDC Pivot on the UGA Tifton Campus, Southwest Research and Education Center near Plains, Vidalia Onion & Vegetable Research Center near Lyons, and the Southeast Research and Education Center near Midville) on April 30, 2018. If you have been running the TIPs tool over the past few weeks you will have noticed that the TIPs tool output has been changing due to cooler than normal temperatures. Thrips development, as well as cotton growth, slows when temperatures are cooler. The TIPs model is more precise when using real weather data and not forecasted or historical data beyond that of a reliable forecast. When looking at the outputs, I was surprised at the variability among locations. However this should be expected as thrips risk is based on temperature and rainfall events which also vary among locations.
When looking at Figure 1 outputs from the six locations, thrips risk is higher in 2018 on most planting dates for all locations. Recall that 2017 was a very light thrips year as a whole. When looking a Figure 2 outputs (within year Thrips Risk) there are significant differences among locations. Attapulgus tends to follow trends we have seen in years past with risk being reduced as planting dates are delayed. Midville is quite different with high risk predicted during the first week of May. Tifton, Plains, and Lyons are somewhere in the middle. I encourage you to take a look at the TIPs tool for your area and we will learn together how we can make better proactive decisions for thrips management.
Relative thrips injury and risk at five locations in Georgia (TIPS April 30, 2018)
Relative thrips risk within year at five locations in Georgia (TIPS April 30, 2018)